


At a glance
- Program: Read 180®
- Subjects: Literacy Curriculum, Intervention Curriculum
- Grade Level: Middle
- Region: Southeast
- Population: Free or Reduced-Price Lunch
- District Urbanicity: Suburban
- District Size: Small
- Implementation Model: 80+ Minutes
Putnam Academy of Arts and Sciences is a tuition-free, public charter school located in Palatka, Florida. Putnam Academy serves approximately 200 middle school level students across Grades 6-8. Putnam’s enrollment by race/ethnicity subgroup is comprised of 51.3% Black/African American, 36.4% White, and 9.2% Hispanic, with approximately 3% in another category. Fifty-nine percent of its students are female and 41% are male. All of Putnam’s students (100%) are economically disadvantaged and 23.6% are identified as With Disabilities.
Students in Grades 6, 7, and 8 received regular ELA instruction daily using HMH Into Literature®. Students qualifying for intervention also received 90-minute Read 180® instruction every other day. In the Double Period Model, classes were held every other day and consisted of 20 minutes of whole-group instruction followed by 20 minutes using the Read 180 online student application, 20 minutes of small-group learning, and 20 minutes of independent reading, and concluding with 10 minutes of whole-group wrap-up. Using these patterns, students completed each station every other school day, or approximately 2.5 times a week. Educators used many of the Read 180 strategies in the core and cross-curricular courses as well to reinforce effective reading strategies in all course content areas.
Administrators and educators received Getting Started professional development as well as ongoing blended coaching sessions delivered in person and via Zoom® throughout the year.
The study included a total of 68 sixth, seventh, and eighth-graders, with nearly 60% of the sample enrolled in Grade 7. More than half were female. The sample were majority Black/African American (54.4%) and not English Language learners (98.5%). Other ethnicities represented included White/Caucasian (38.2%) and Hispanic (7.4%). All students in the sample were socioeconomically disadvantaged, as determined by FRPL eligibility and as reflective of the school's overall population. Nearly half the sample (48.5%) were Students with Disabilities (proportionally higher than the 23.6% in this category for the school overall). Full demographic characteristics for the sample can be found in Table 1.

Software Usage Data
Student software usage data was collected as students used the online Student Application during Read 180 instruction.
Growth Measure Reading
Growth Measure (GM) is a computerized adaptive assessment for Reading and Mathematics and is a standards-based interim assessment tool developed for Kindergarten through Grade 11. Reading assessments are for Grades 2 through 11. The GM is typically administered three times per year (e.g., fall, winter, and spring) and includes valid, reliable items that provide deeper student connections to content. The GM assessments provide computerized adaptive online administration for ongoing information about teaching and learning in relation to a wide range of instructional standards, and a range of grade-level expectations via a series of Level Tests.
HMH Reading Inventory
The HMH Reading Inventory® measures reading comprehension proficiency for students in Grades K–12. The Reading Inventory uses adaptive technology to determine a student’s reading comprehension level on the Lexile Framework for Reading; the higher the Lexile® score, the more challenging reading material the student can comprehend. Assessment results include a Lexile scale score that indicates reading ability at a level of text complexity and a performance level of Below Basic, Basic, Proficient, or Advanced, indicating achieved reading comprehension compared to grade-level expectations.
Florida Assessment of Student Thinking (FAST)
The Florida Assessment of Student Thinking (FAST) was designed to measure student progress in achieving end-of-year Benchmarks for Excellent Student Thinking (BEST) ELA standards. PK through Grade 10 students completed the computer-adaptive assessment three times a year (beginning of year, middle of year, and end of year), serving both as a progress monitoring and summative assessment. Assessment results include a scale score that corresponds to Performance Level Descriptors based on grade-level cutoff scores with a level 3 or higher indicating satisfactory performance (PLD; 1 = well below grade level, 2 = below grade level, 3 = on grade level, 4 = proficient, and 5 = exemplary). FAST scale scores reported during the 2022–2023 school year remained on the same scale as prior-year FSA scores to allow for multi-year comparisons.
Class Grades
This measure reflects each student's earned English language arts class grade as assigned by their corresponding teacher. These were collected for Fall 2021, Spring 2022, Fall 2022, and Spring 2023.
An independent evaluator from Prosody Consulting, LLC analyzed student academic achievement using data provided by the Putnam Academy of Arts and Sciences and Houghton Mifflin Harcourt. Read 180 students’ ELA performance was examined pre- and post-Read 180 usage using multiple independent outcome measures.
Software usage data included number of completed segments, number of completed sessions, average total time, average sessions spent per segment, number of sessions averaged per week, and average time per session. The summary statistics for the sample can be found in Table 2.

Growth Measure Reading Measures
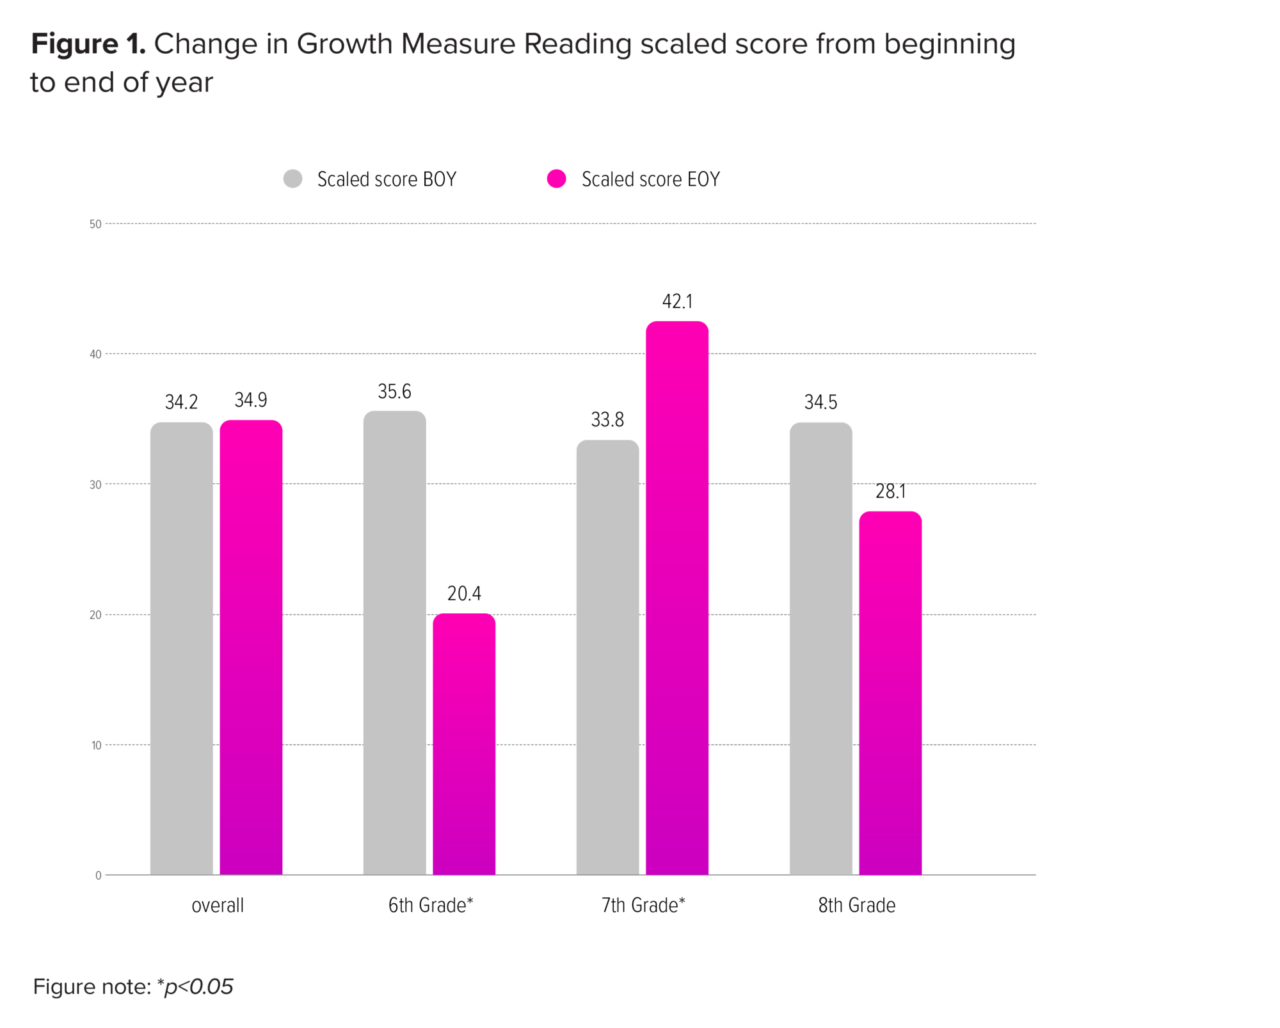
A growth analysis using the scaled score change from the beginning of the year to the end of the year yielded mixed results. The change in Grade 6 and Grade 7 scaled scores was significant with large magnitudes of effect (n=9, p<0.05, d=.1.46 and n=40, p<0.05, d=.0.67) respectively. However, the scaled score change for Grade 8 was not significant (n=19, p>0.05, d=.33). These differences are illustrated in Figure 1.
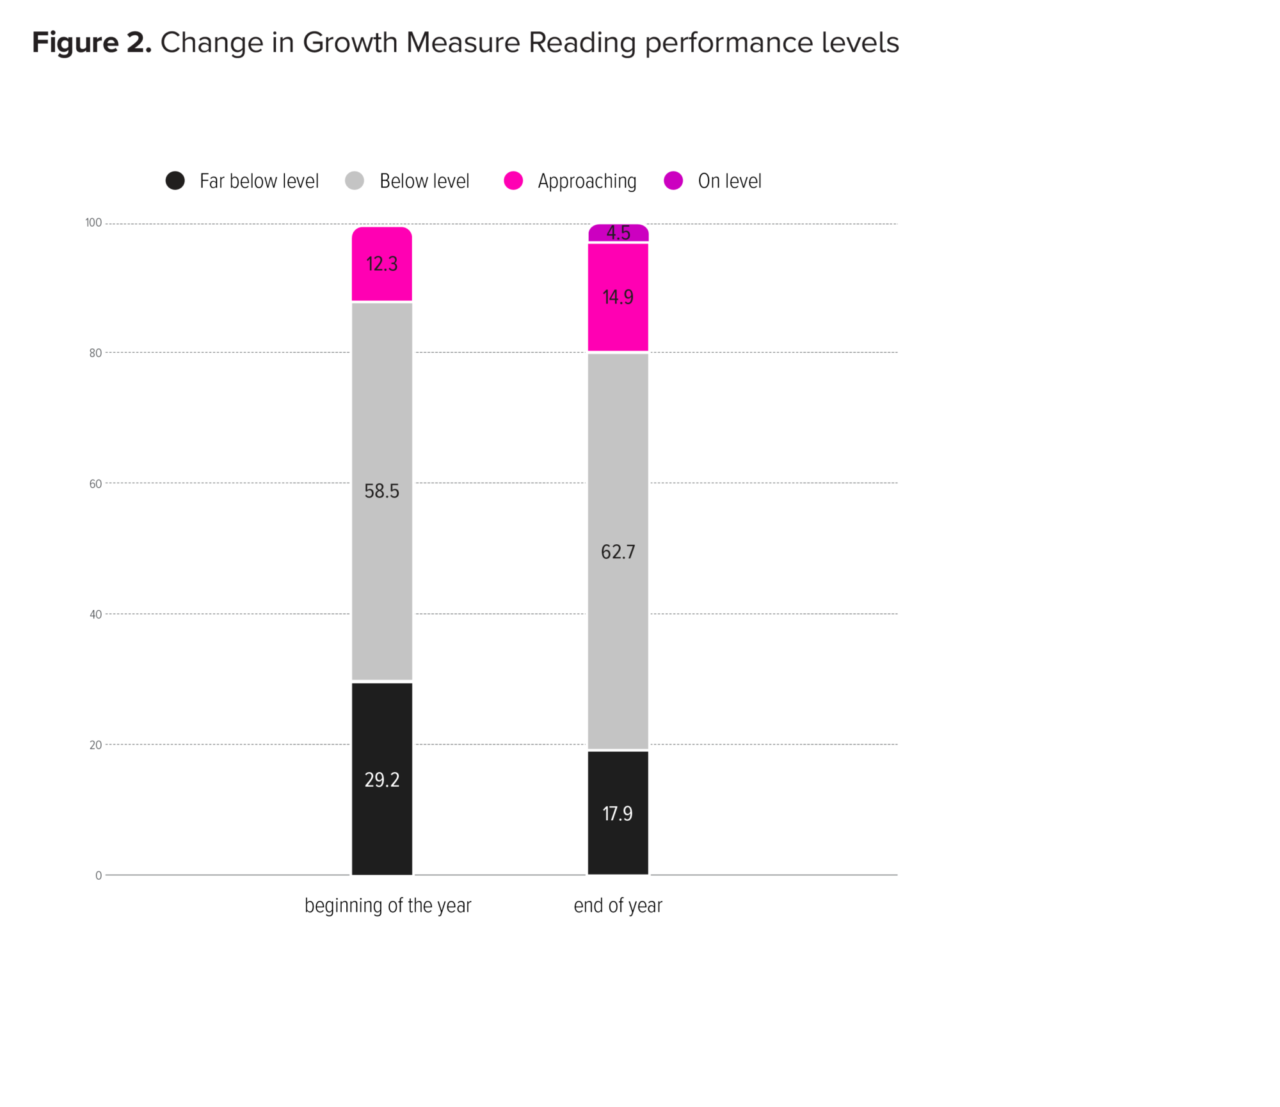
Change in overall performance level also showed a significant improvement (p<0.05) from the beginning of the year to the end of the year with the percentage of students scoring at least “approaching level” increasing from 12% to 19% (p<0.05). See Figure 2.
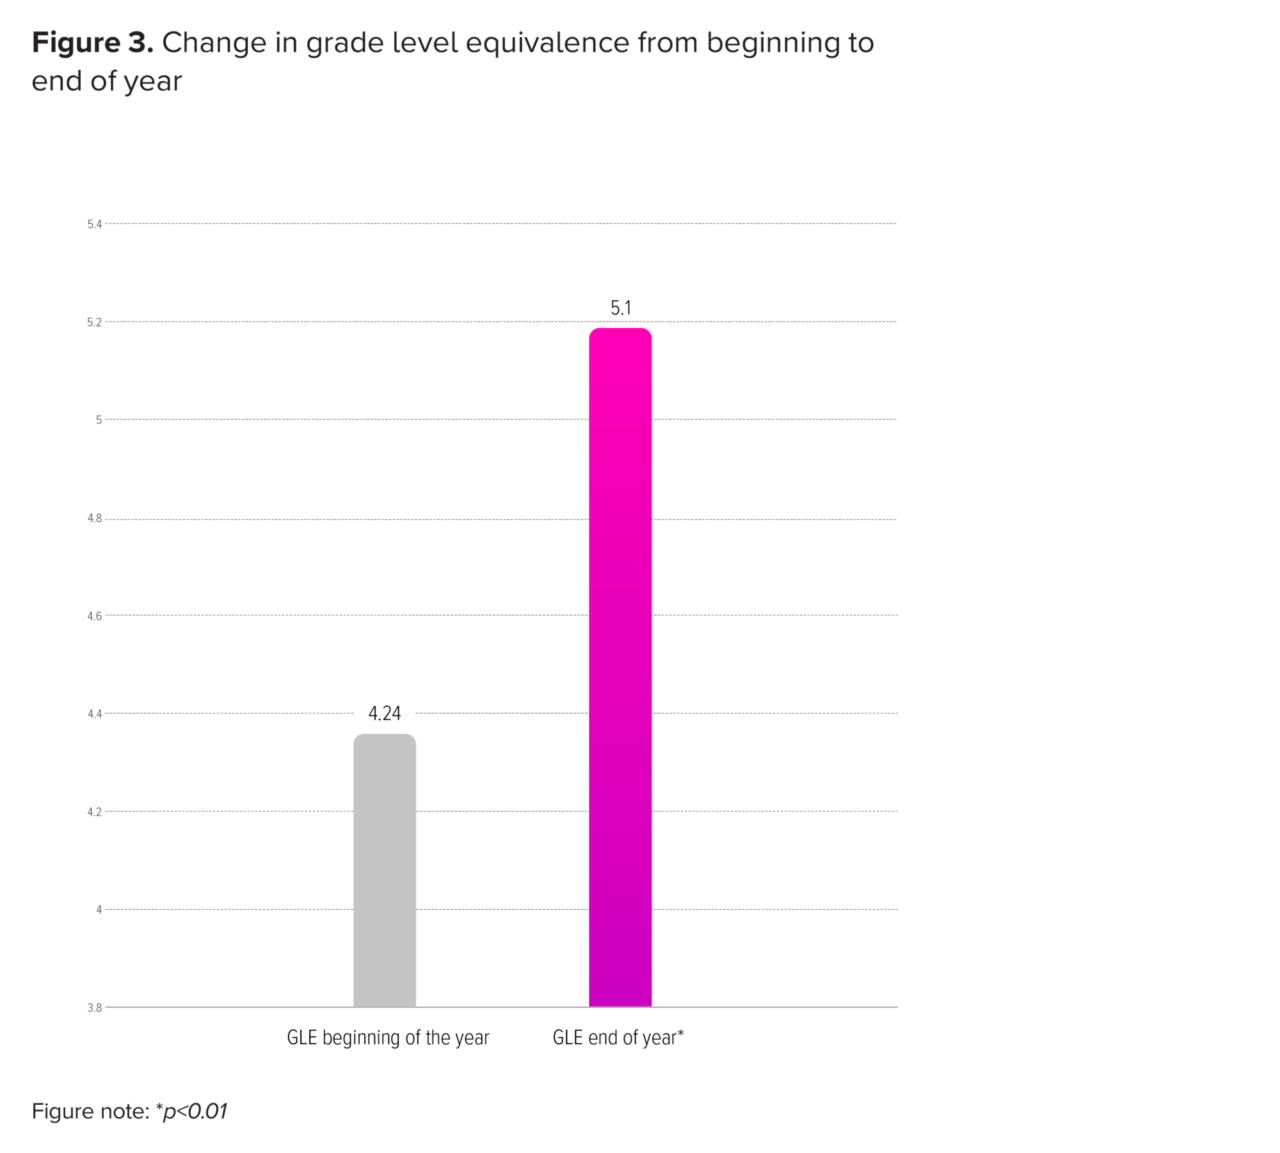
Grade level equivalence was compared between beginning of year levels and end of year levels with a statistically significant change present (p<0.01, d=0.48). However, the mean difference was less than one whole grade level. See Figure 3.
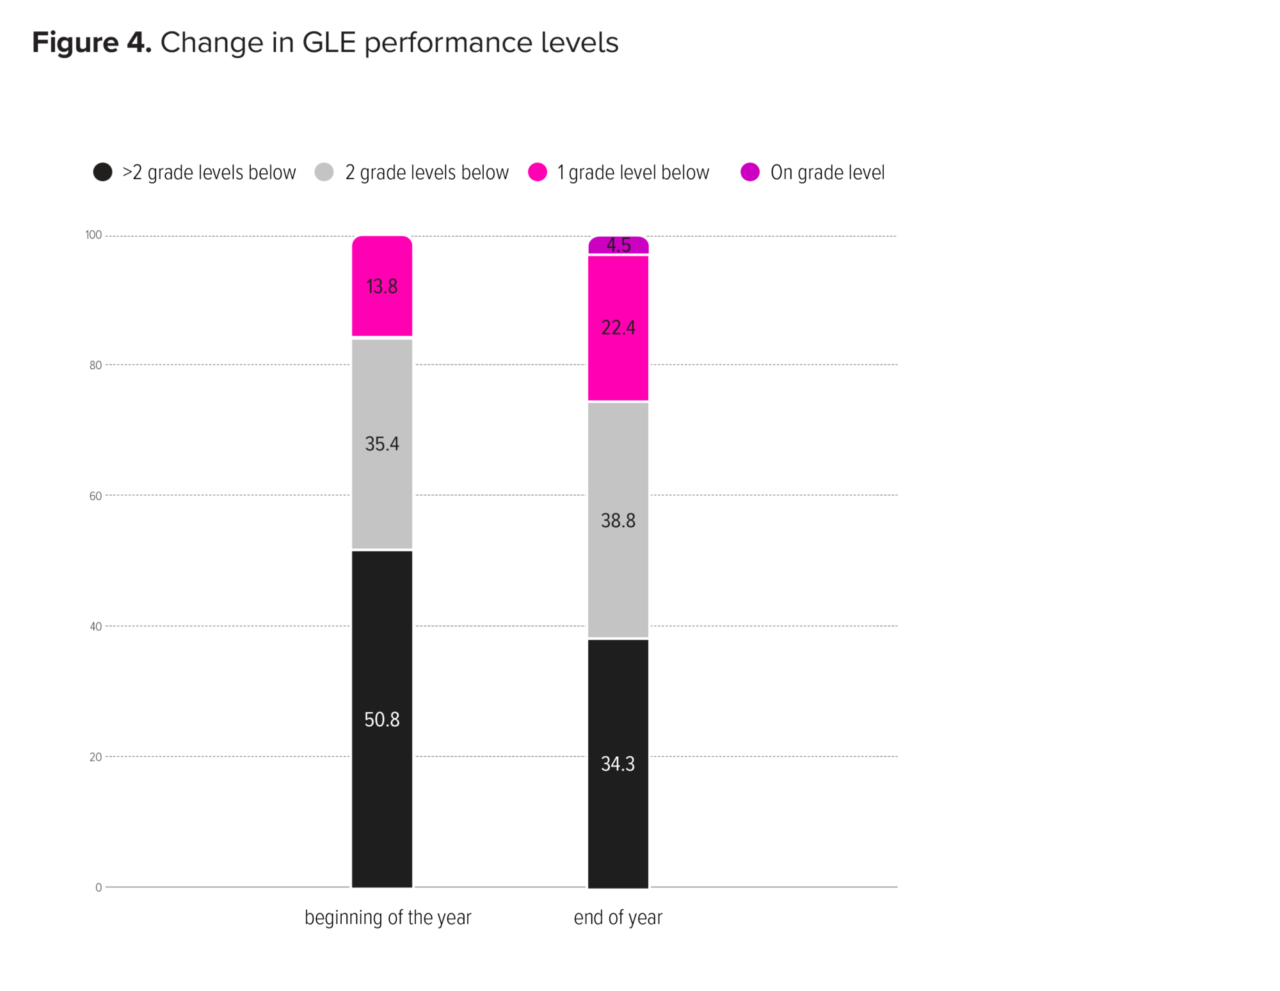
Change in grade level equivalence performance category showed a significant improvement (p<0.05) from the beginning of the year to the end of the year with the percentage of students scoring “on grade level” increasing from 0% to 4.5% (p<0.05). See Figure 4.
Reading Inventory Analysis
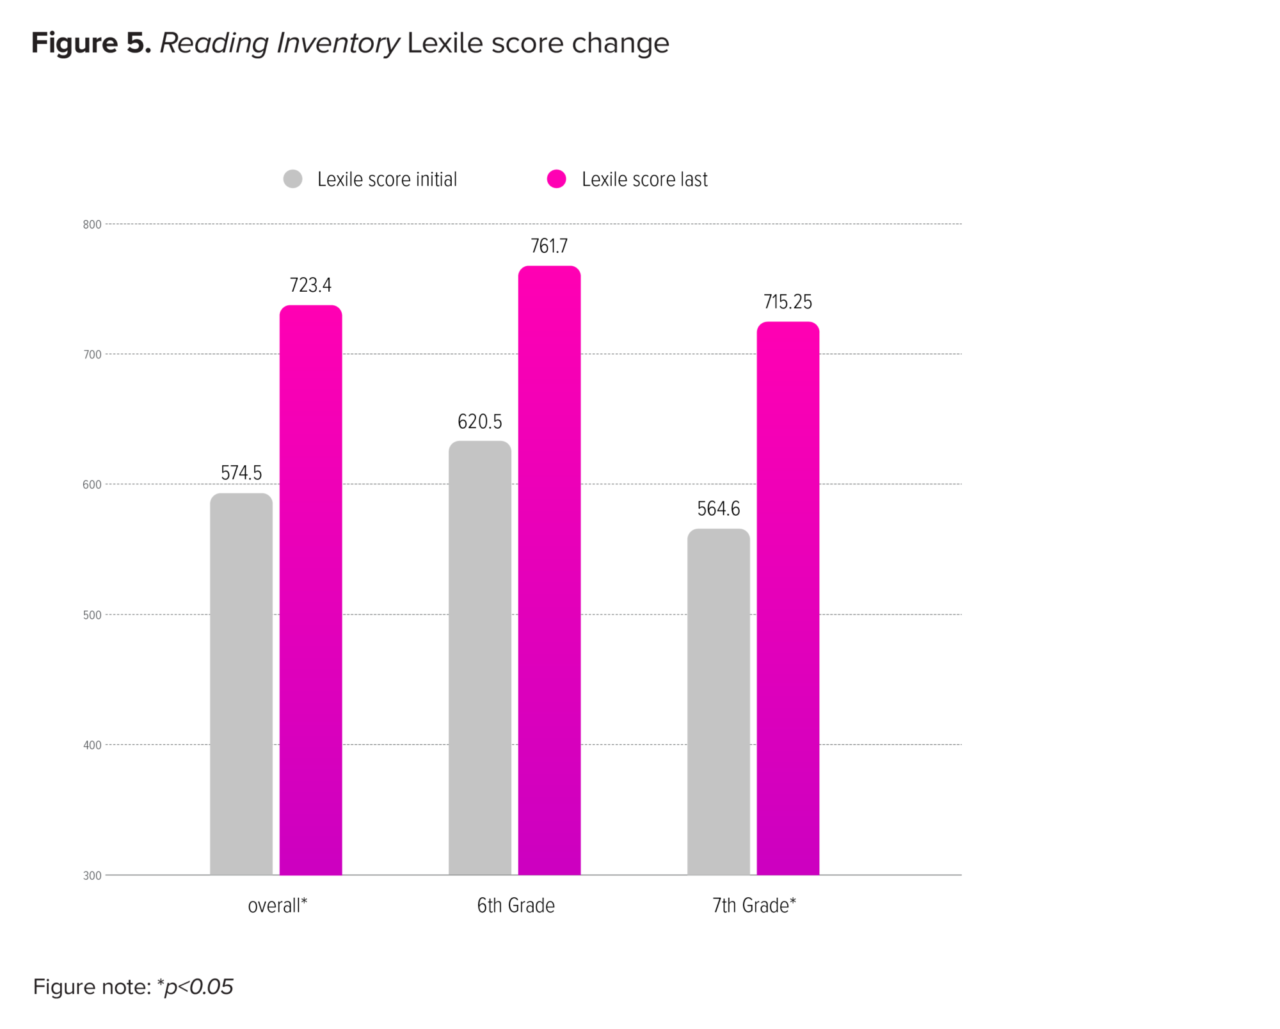
Reading Inventory results were analyzed for Grade 6 and Grade 7 students in the sample. No Lexile data was available for Grade 8 and Lexile data was missing for three sixth graders and 12 seventh graders. Analyses of main effects found that from initial testing to final testing students demonstrated significantly higher Lexile scores overall (n=34, p<0.05, d=0.88) and for Grade 7 (n=28, p<0.05, d=0.86), but not for Grade 6 (n=6, p=0.07, d=0.93). All three groups demonstrated large magnitudes of effect, however. This is shown in Figure 5. The overall Lexile score change of 148 indicates across the sample students grew 1.76 years. The Lexile score change of 150 for Grade 7 indicates those students grew 1.7 years. The Lexile score change of 141 for Grade 6 indicates those students grew 1.85 years.
Change in overall performance also showed a significant improvement from the initial test administration to the last, with the percentage of students scoring at least “proficient” increasing from 8% to 19% (p<0.05). See Figure 6.

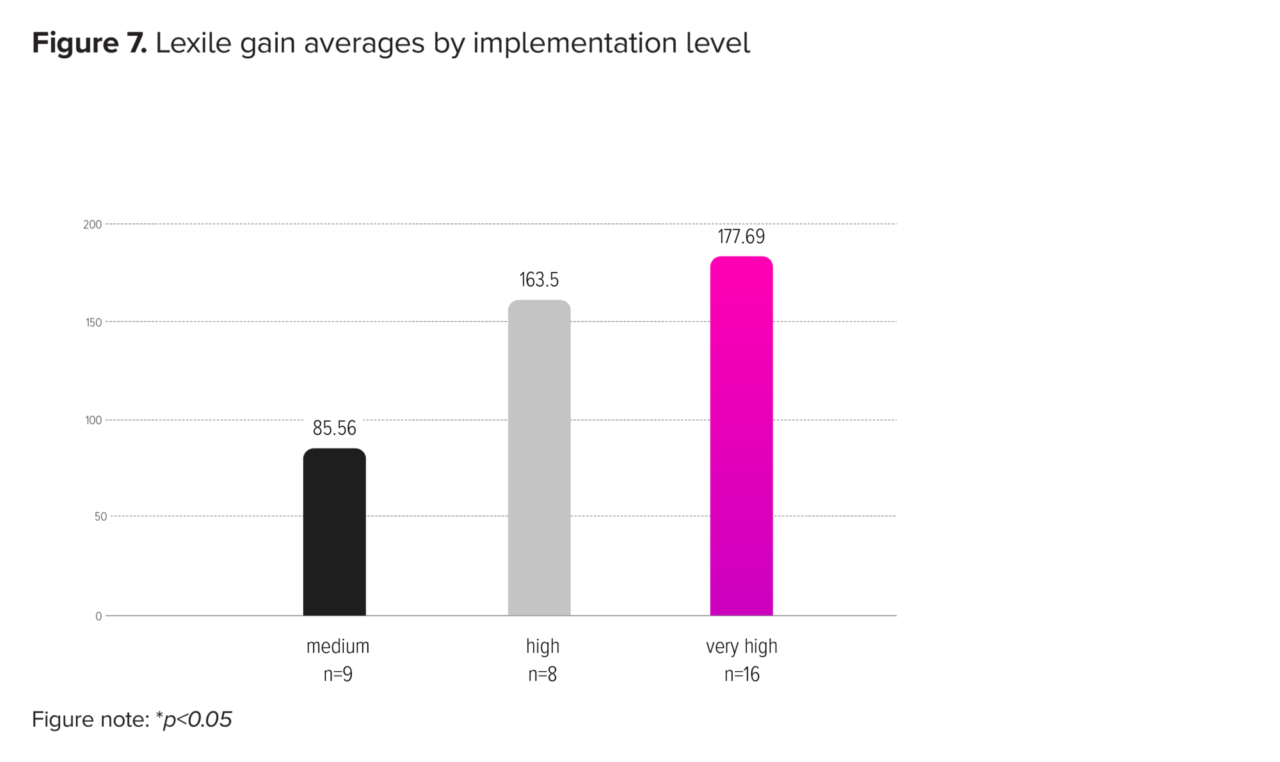
Lexile score gain based upon implementation level showed no significant differences between the four categories. The “very high” implementation group had the highest average Lexile gain of 177.69 and the "medium" group demonstrated the lowest gain of 85.56. See Figure 7. Note that there was only one student in the low implementation group.
Independent reading metrics were collected and demonstrated that the average number of tests taken was 15.19, the average number of tests passed was 9.9, and the number of words read was 25,441.
Florida Assessment of Student Thinking (FAST)
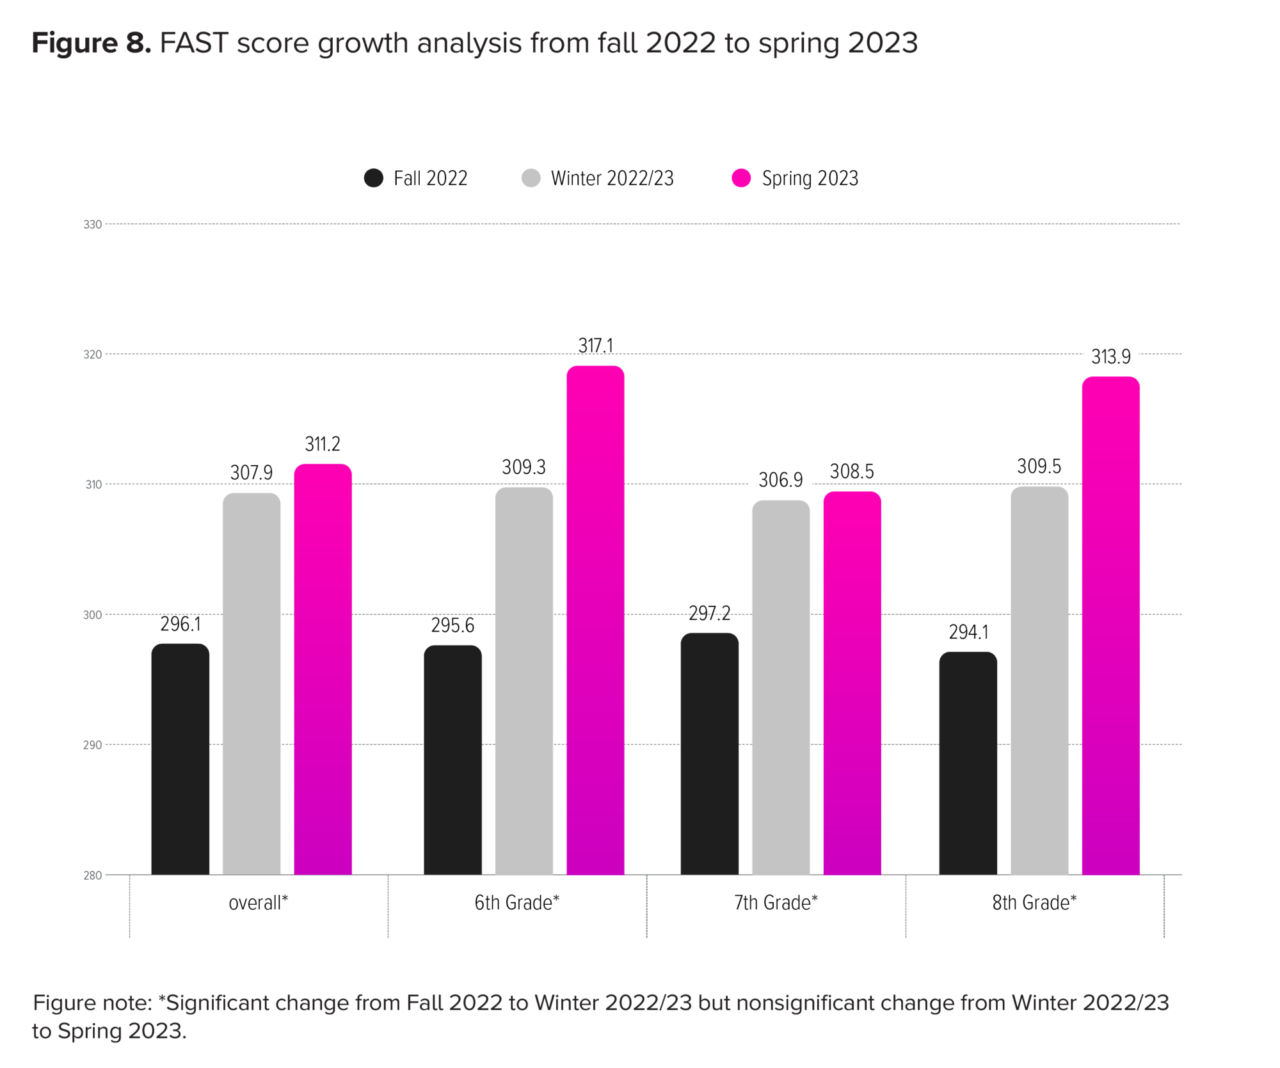
A growth analysis using the FAST assessment change from the beginning of the year to the end of the year yielded significant changes overall and at each grade level. Overall the change in FAST score was significant (p<0.05) from Fall 2022 to Winter 2022/23 but not significant from Winter 2022/23 to Spring of 2023. This pattern was also found at each individual grade level. Large magnitudes of effect were found with effect sizes ranging from 0.15 to 0.4. These differences are illustrated in Figure 8.
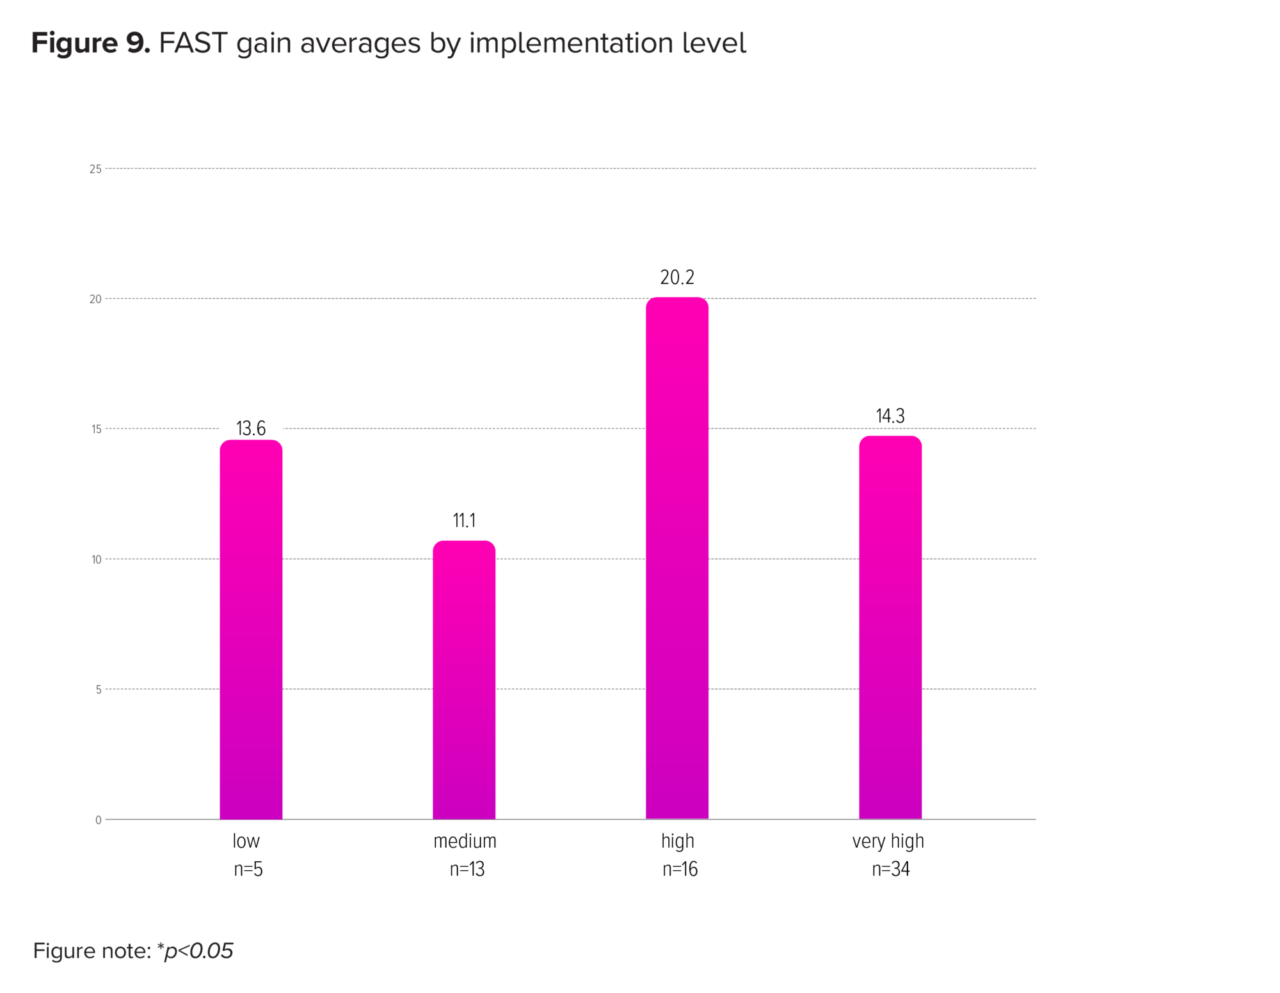
FAST score gain from Fall 2022 to Spring 2023 based upon implementation level showed no significant differences among the four categories. The “high” implementation group had the highest average FAST gain of 20.2 and the lowest gain of 11.1 was demonstrated by the “medium” group. This is shown in Figure 9.
ELA Class Grade Change
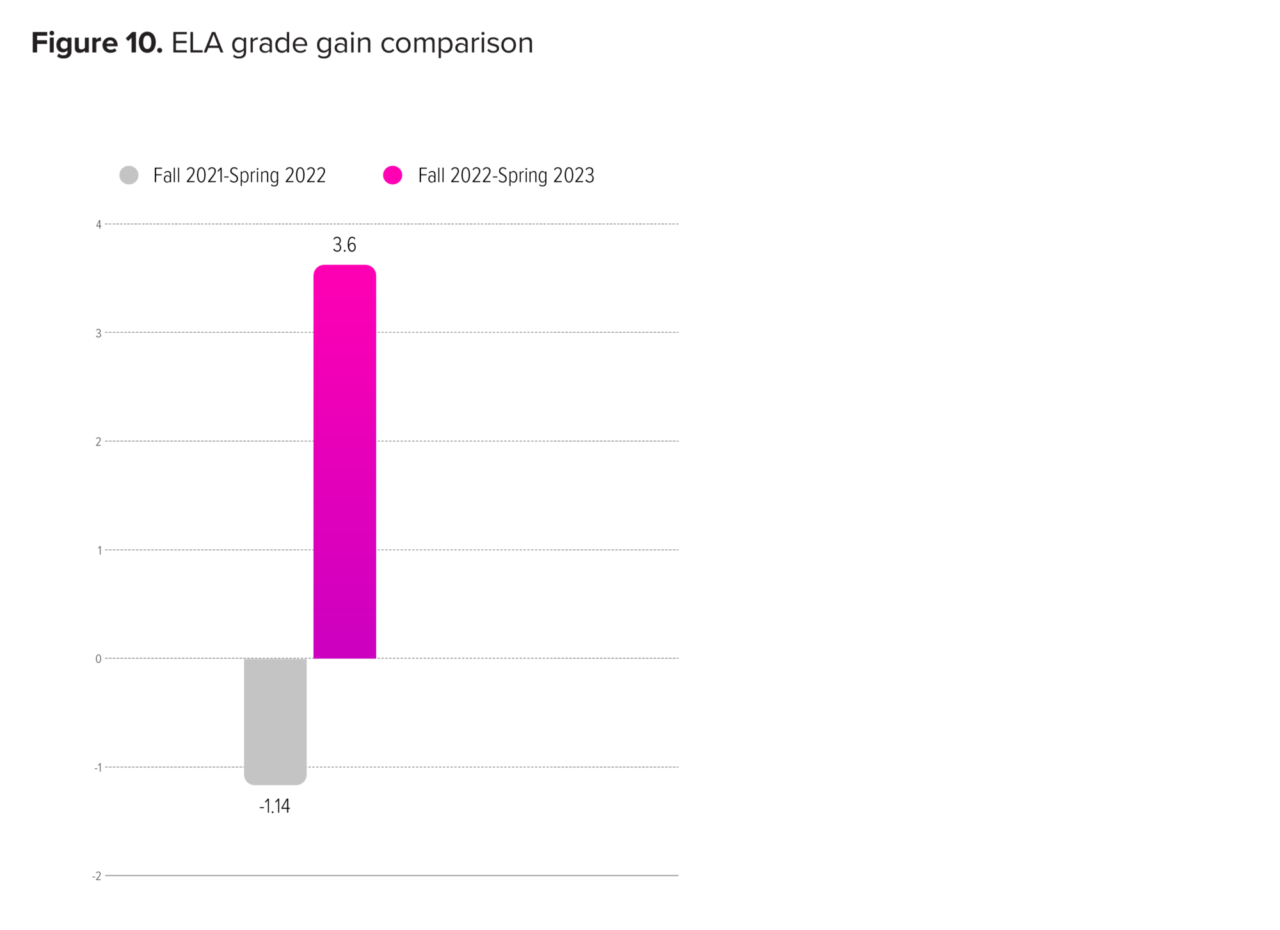
An analysis comparing the growth in ELA grade between two time periods (Fall 2021 to Spring 2022 vs. Fall 2022 to Spring 2023) demonstrated a significant difference in the grade change between the two periods (p<0.01, d=0.59). The average grade gain was 3.6 points larger from Fall 2022 to Spring 2023 compared to Fall 2021 to Spring 2022. Therefore, these results show that students’ class grades were positively impacted during the year students used Read 180. See Figure 10.
Results from this Read 180 study showed that program usage is associated with positive effects in reading performance across several metrics.
Students demonstrated statistically significant performance improvements on the Reading Inventory Assessment, Growth Measure Reading scaled score, FAST, and ELA class grades (p<.05). These differences generally were attended by at least moderate effect sizes. Changes in performance were related to the level of usage for the program with “High” and “Very High” users showing the greatest performance gains. Furthermore, results showed that Read 180 students’ class grades were positively impacted as well.
The sample of participants included high proportions of students from historically disadvantaged backgrounds as well as with disabilities (see Table 1), suggesting that Read 180 is effective with these demographic groups.
Results from this study provide consistent evidence that Read 180 is an efficacious reading program that can help accelerate student learning.